
2021 continues to prove itself as a fast-paced seller’s market year for real estate. Baldwin REALTORS® Multiple Listing Service (MLS) reports February year-over-year increases in properties sold, …
This item is available in full to subscribers.
Please log in to continue |
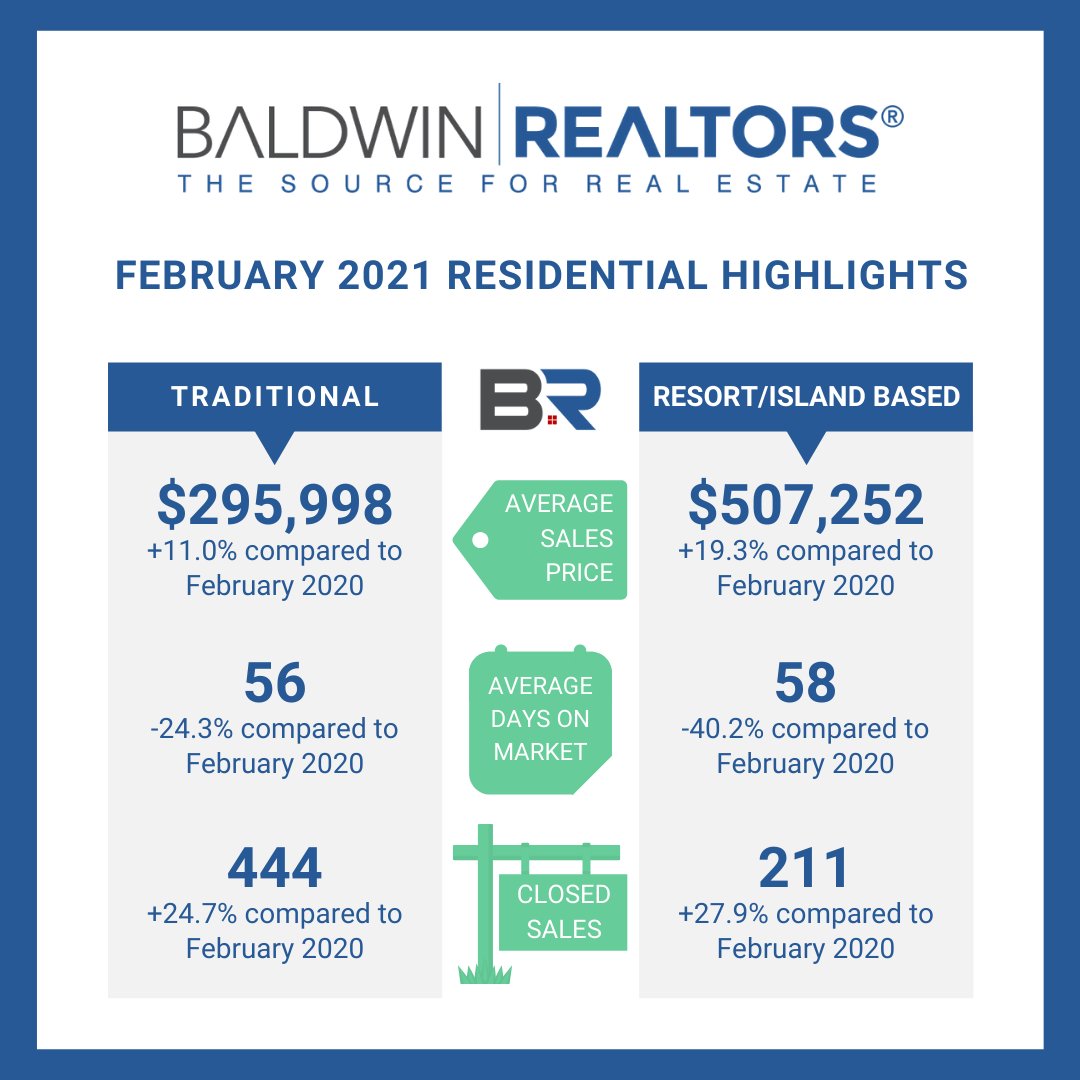
2021 continues to prove itself as a fast-paced seller’s market year for real estate. Baldwin REALTORS® Multiple Listing Service (MLS) reports February year-over-year increases in properties sold, average sales price and new listings for both the Resort and Traditional Residential areas of Baldwin County.
Total sales volume for the county increased by 44.4% from $165,108,215 in February 2020 to $238,453,533 this past month.
For Traditional Residential properties in Baldwin County, a total of 444 sold last month, compared to 356 in February 2020.
Average sales price increased from February 2020 by 11% with an average of $295,998 for properties in this area. Average days on market (DOM) for this area of the county continue to be below the national average with this month reporting 56 DOM.
The Resort area of Baldwin County saw significantly positive trends this past month. A total of 211 properties sold, compared to 165 in February 2020 – a 27.9% increase. Average sales price continues to be above $500K at $507,252. And average DOM decreased by a whopping 40.2% from February 2020 with only 58 days in comparison to 97.
Residential MLS Stats by Area:
Central Baldwin
•• Residential Properties sold in February 2021: 221
•• Average Sales Price: $214,437
•• Average Days on Market: 76
•• Average Sales Price Change from February 2020: Increased 20.4%
Coastal Condos
•• Residential Properties sold in February 2021: 136
•• Average Sales Price: $442,473
•• Average Days on Market: 51
•• Average Sales Price Change from February 2020: Increased 6.3%
Coastal Homes
•• Residential Properties sold in February 2021: 117
•• Average Sales Price: $534,979
•• Average Days on Market: 66
•• Average Sales Price Change from February 2020: Increased 31.1%
Eastern Shore
•• Residential Properties sold in February 2021: 209
•• Average Sales Price: $354,284
•• Average Days on Market: 68
•• Average Sales Price Change from February 2020: Increased 13.2%
North Baldwin
•• Residential Properties sold in February 2021: 24
•• Average Sales Price: $195,796
•• Average Days on Market: 42
•• Average Sales Price Change from February 2020: Increased 35.1%


