
This past month's local real estate market was an even playing field for sellers and buyers. Baldwin REALTORS® Multiple Listing Service (MLS) reports year-over-year increases from August 2022 to …
This item is available in full to subscribers.
Please log in to continue |
This past month's local real estate market was an even playing field for sellers and buyers.
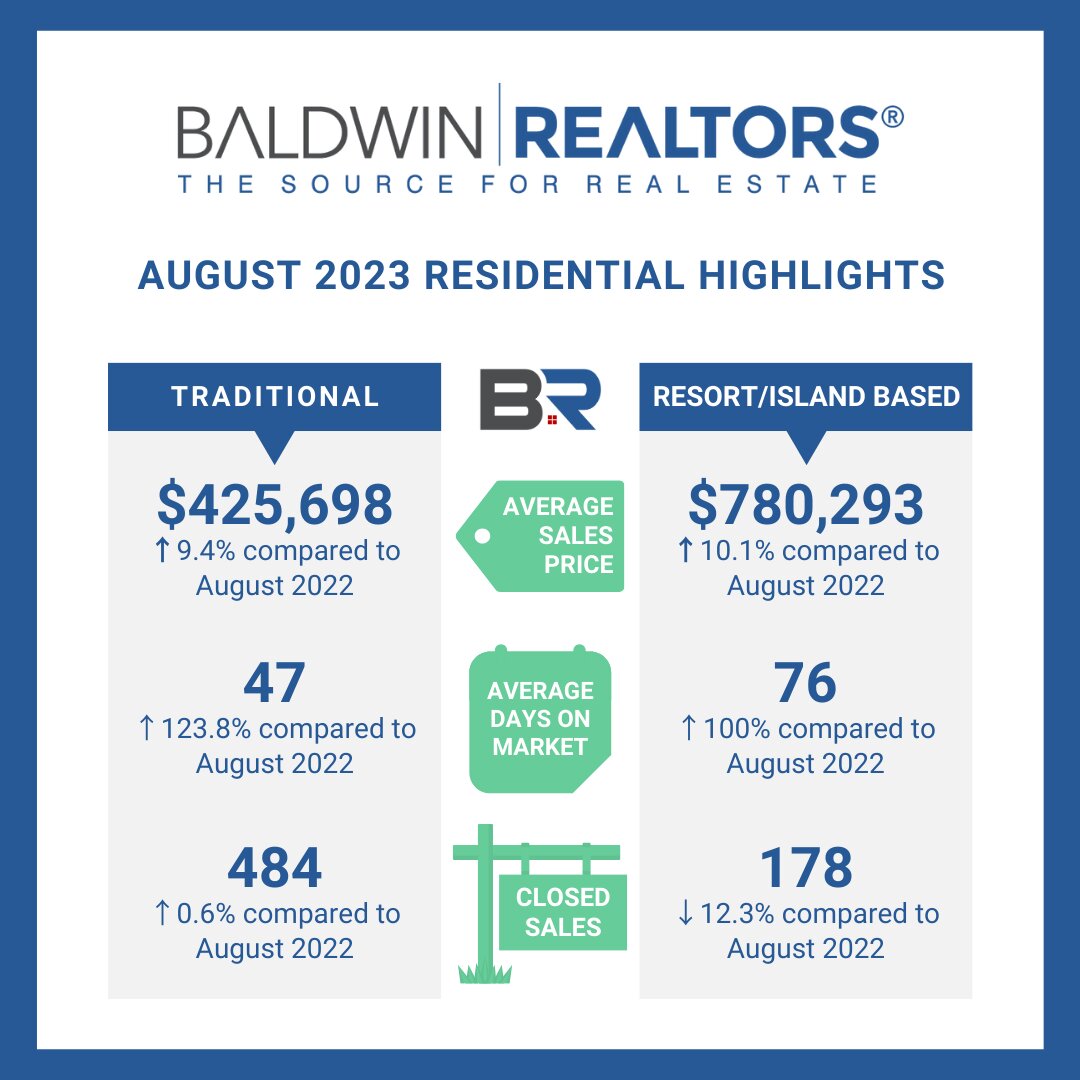
Baldwin REALTORS® Multiple Listing Service (MLS) reports year-over-year increases from August 2022 to August 2023 in average sales price and days on market for both the traditional residential and resort areas of Baldwin County real estate. Housing supply continues to be low on a national scale, resulting in demand that continues to drive up sales prices. However, buyers can consider an investment, as properties are not selling as quickly.
For August 2023, the resort area of Baldwin County (all of Orange Beach, Fort Morgan and anything in Gulf Shores south of Canal Road/180) saw average sales price increase by 10.1% from August 2022, resulting in an average of $780,293. Listings spent more time on the on market at an average of 76 days, compared to just 38 days the year prior. A decrease was reported in total closed sales as 178 properties solid in August 2023, compared to 203 in August 2022.
Baldwin County's traditional residential area (everything else in Baldwin County not included in the resort market areas) also saw average sales price increase by 9.4% from August 2022 at $425,698. Properties stayed on market longer with an average of 47 days, which is 26 more days than the average a year ago. Total closed sales for this area of the county reports a gain of 3 additional properties from the previous year at 484 properties sold.
Central Baldwin
• Residential properties sold in August 2023: 239
• Average sales price: $293,903
• Average days on market: 78
• Average sales price change from August 2022: Increased 2.0%
Coastal condos
• Residential properties sold in August 2023: 115
• Average sales price: $593,353
• Average days on market: 77
• Average sales price change from August 2022: Increased 5.6%
Coastal homes
• Residential properties sold in August 2023: 114
• Average sales price: $749,677
• Average days on market:: 77
• Average sales price change from August 2022: Increased 16.1%
Eastern Shore
• Residential properties sold in August 2023: 218
• Average sales price: $452,006
• Average days on market:44
• Average sales price change from August 2022: Increased 5.6%
North Baldwin
• Residential properties sold in August 2023: 19
• Average sales price: $253,692
• Average days on market: 40
• Average sales price change from August 2022: Decreased 1.1%


